Trendtracking reporting to clients: your template for measurable GEO results
Why trendtracking reporting makes the difference for your client relationship
AI visibility is not a one-time measurement. It is a continuous process that requires structural monitoring and clear communication with your clients. Yet many consultants struggle with the same challenge: how do you report the progress of Generative Engine Optimization in a way that is both strategic and understandable?
The problem is recognizable. Traditional SEO reports revolve around rankings and search volumes, but those figures tell nothing about how AI engines like ChatGPT, Perplexity or Google AI Overviews speak about your client's brand.
Without trendtracking you miss the evidence for your content investments. With the right reporting format, you turn that around.
What belongs in a trendtracking report?
A strong report is not a data dump. It is a story that starts with the score, moves through the cause and ends with the action. Use the following structure as a basis for each quarterly report.
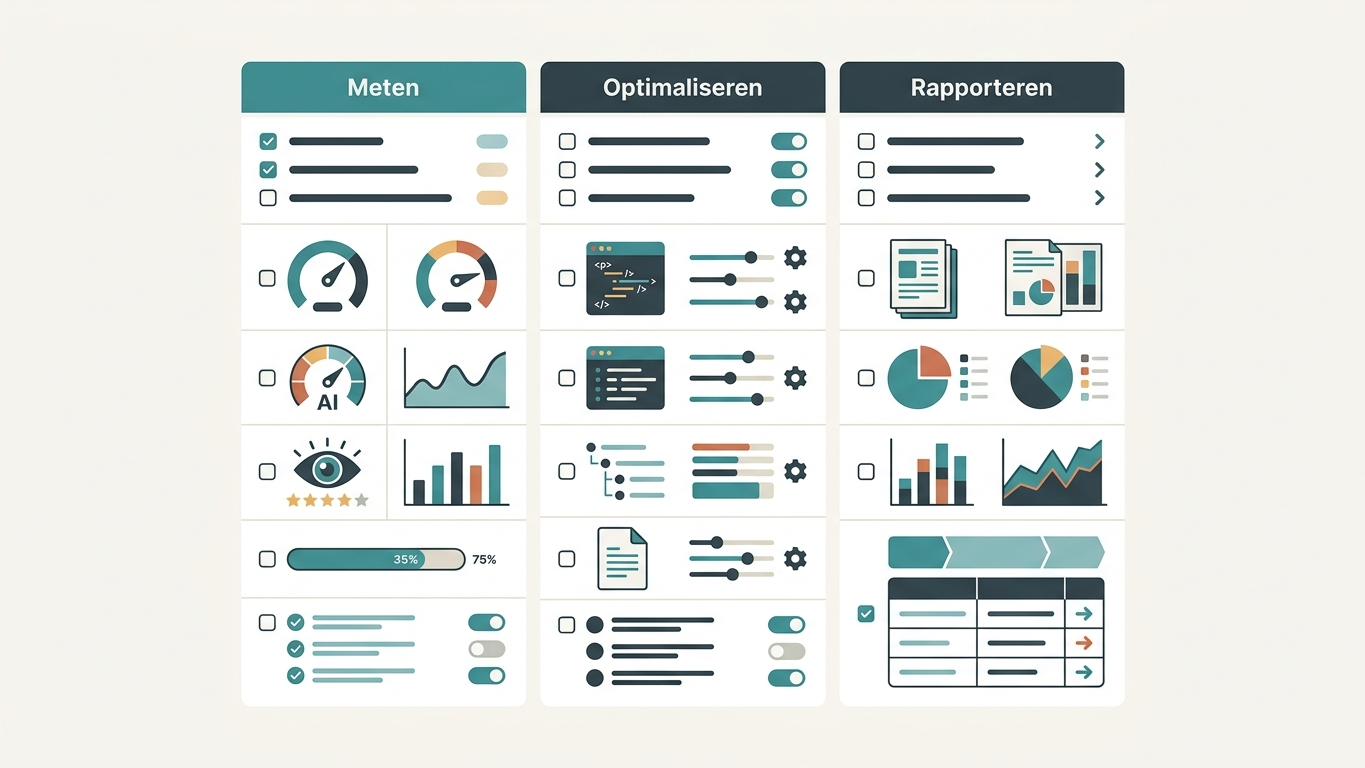
The fixed components of your report
| Component | Purpose | Audience |
|---|---|---|
| Executive summary | Strategic overview in 30 seconds | Decision maker |
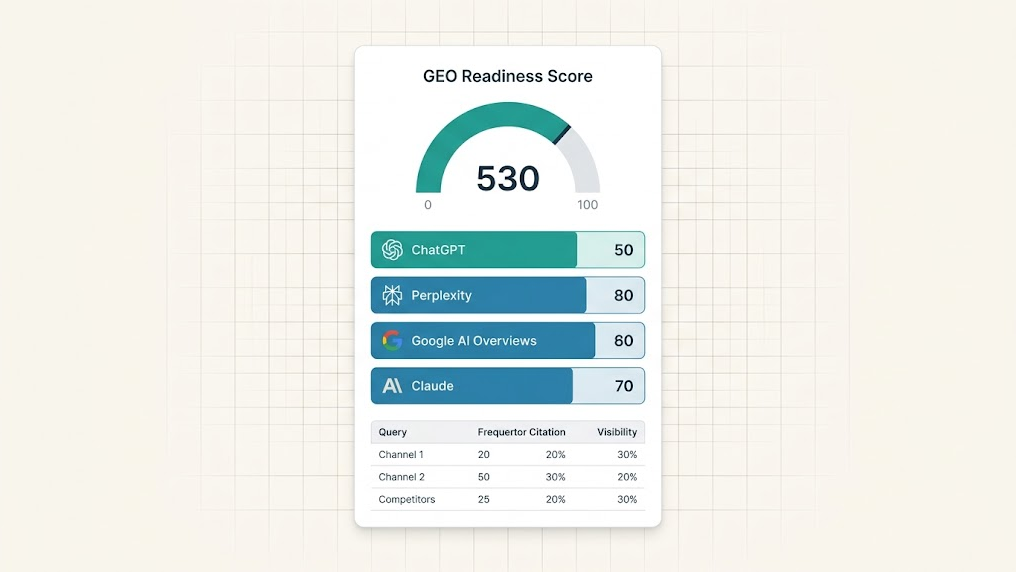
| GEO Score development (0-100) | Quantify progress per quarter | All stakeholders |
| Platform comparison | Show visibility per AI engine | Marketer |
| Per-page query mapping | Technical deep-dive analysis per URL | Developer |
| Competitive position | Relative position in AI answers | Decision maker and marketer |
| Action plan next quarter | Directly applicable recommendations | All stakeholders |
This structure aligns with the three audience groups you serve as a consultant. The decision maker wants to see ROI. The marketer wants to know which platforms the brand wins or loses on. The developer wants concrete tasks.
Template: how to build your quarterly report
Use this template as a starting point and adapt it to your client's industry and knowledge level. Each component has a fixed structure.
1. Executive summary (max. 5 sentences)
Open with the current GEO Score and the change compared to the previous quarter. Name the most important shift, positive or negative. Close with the strategic recommendation for the coming quarter.
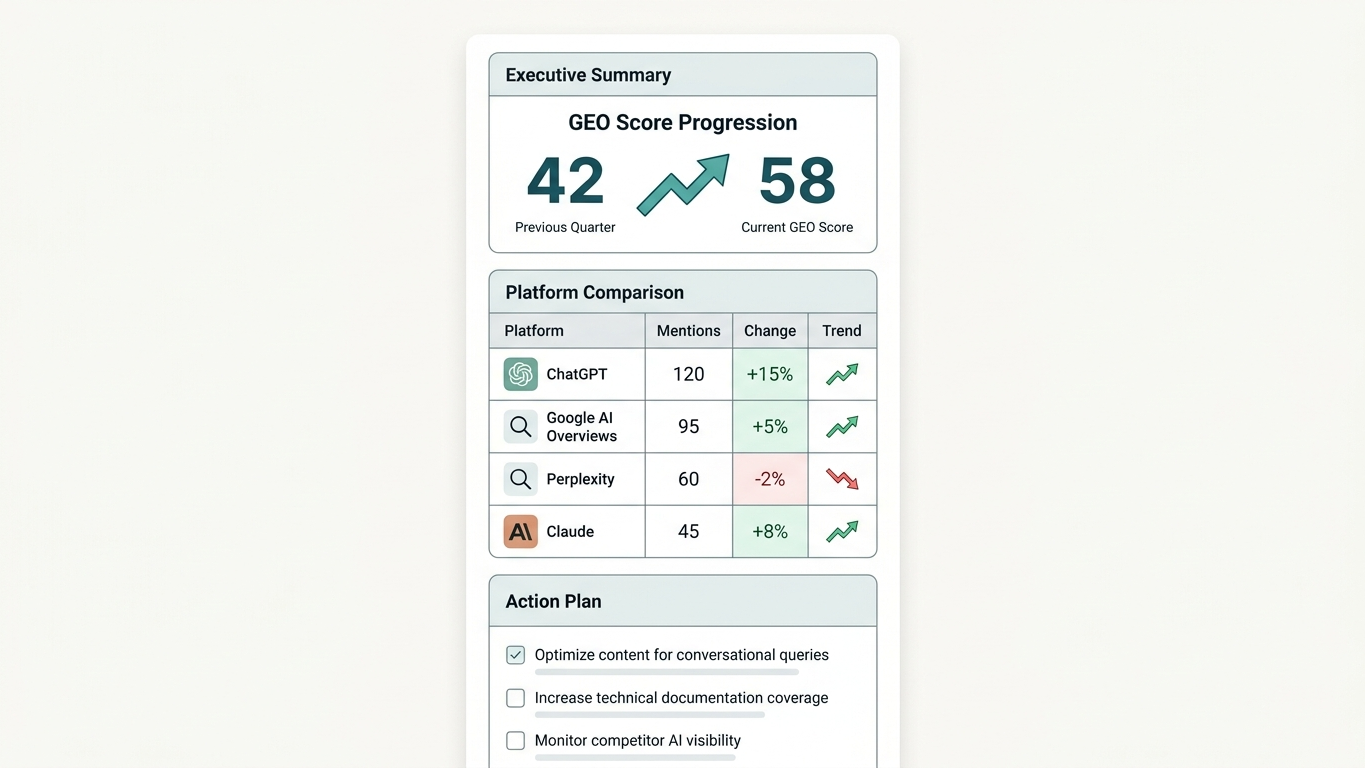
Example: "The GEO Score of [client name] has increased from 42 to 58 (+16 points). The biggest gain comes from improved citability on product pages. For Q3 we advise focusing on schema markup for service pages."
2. Platform-specific visibility
Report per AI engine separately. The answers from ChatGPT, Perplexity, Google AI Overviews and Claude are fundamentally different. A brand can be dominant in Perplexity but completely absent in Google AI.
Use a simple table per platform:
| Platform | Mentions Q1 | Mentions Q2 | Trend |
|---|---|---|---|
| ChatGPT | 3/25 queries | 8/25 queries | Rising |
| Google AI Overviews | 5/25 queries | 7/25 queries | Stable |
| Perplexity | 1/25 queries | 4/25 queries | Rising |
| Claude | 0/25 queries | 2/25 queries | Newly visible |
With the GrowthScope Deep Scan you automate this measurement on 25 industry-relevant queries. This saves you the manual checking that would otherwise take hours.
3. Competitive position
AI answers are a zero-sum game. If your client is not mentioned, a competitor gets that spot.
Always show the relative position. Name which competitor is cited most often and analyze why.
4. Technical progress
Report here the status of technical GEO elements:
- llms.txt configuration: is the file present and correctly configured? Read more about why llms.txt is essential.
- Schema markup: which pages are equipped with structured data?
- Citability: which content has been rewritten for algorithmic relevance?
- robots.txt: do you allow AI crawlers or block them?
5. Action plan next quarter
Close each report with a maximum of five concrete actions. Prioritize by impact and feasibility. Link each action to an expected score improvement.
Best practices for trendtracking reports
Beyond structure, execution determines the success of your report. Follow these guidelines.
- Report quarterly, not monthly. AI models are not updated daily. Quarterly measurements provide more reliable trends. The Quarterly subscription fully automates this process.
- Avoid jargon without context. Never mention a technical term like citability without immediately naming the business impact: "Your product pages are cited 3x more often, leading to greater brand visibility in AI answers."
- Use visual trend lines. A GEO Score rising from 34 to 61 over three quarters is more powerful as a line than as a number.
- Start with the wins. Always open with what has improved. This strengthens confidence in your strategy before you address the points of attention.
- Benchmark against the industry. A score of 55 means little without context. Compare it with the industry average or direct competitors.
Common mistakes in GEO reports
Even experienced consultants fall into these traps:
- Only reporting whether a brand is "mentioned or not mentioned" without analyzing the context or sentiment.
- Not distinguishing between platforms, while each AI model prefers different sources.
- Decoupling the report from the action plan, so the client receives data but no direction.
- Not re-auditing after implementing recommendations, making the impact unmeasurable.
Start today with structured trendtracking
Consultants who now invest in a repeatable reporting format are building long-term client relationships. With each re-audit you show the improvement of the GEO Score as a direct result of your strategy. That is not an abstract story, that is measurable value.
Want to get started right away? Start your first audit and use this template to show your client within a quarter what AI visibility really delivers.
Have questions about setting up trendtracking for your clients? Get in touch and we'll think along with you.