Allocating Budget for GEO: How to Calculate the Investment Your AI Visibility Delivers
Why You Need to Free Up Budget for Generative Engine Optimization Now
Your competitors are already appearing in answers from ChatGPT, Perplexity, and Google AI Overviews. While traditional SEO budgets are under pressure due to declining click-through rates, the share of AI-driven answers is growing exponentially.
The question is no longer whether you invest in generative engine optimization (GEO), but how much and how quickly.
Yet marketing managers struggle with translating this into a concrete calculation model. Without benchmarks, it's difficult to convince stakeholders. This guide gives you the numbers, the comparison, and a clear framework to support your GEO budget.
The Shift from SEO Budget to GEO Budget
Organic traffic from traditional search engines is declining on average 15 to 25 percent in search queries where AI Overviews are shown. This means a portion of your current SEO investment yields less return. At the same time, a new channel emerges: AI-generated summaries that either mention your brand or don't.
Smart budget allocation doesn't mean you replace SEO. You shift a strategic portion toward GEO, so you remain visible on both fronts. Think of it as a reallocation of existing marketing budget, not as an additional cost item.
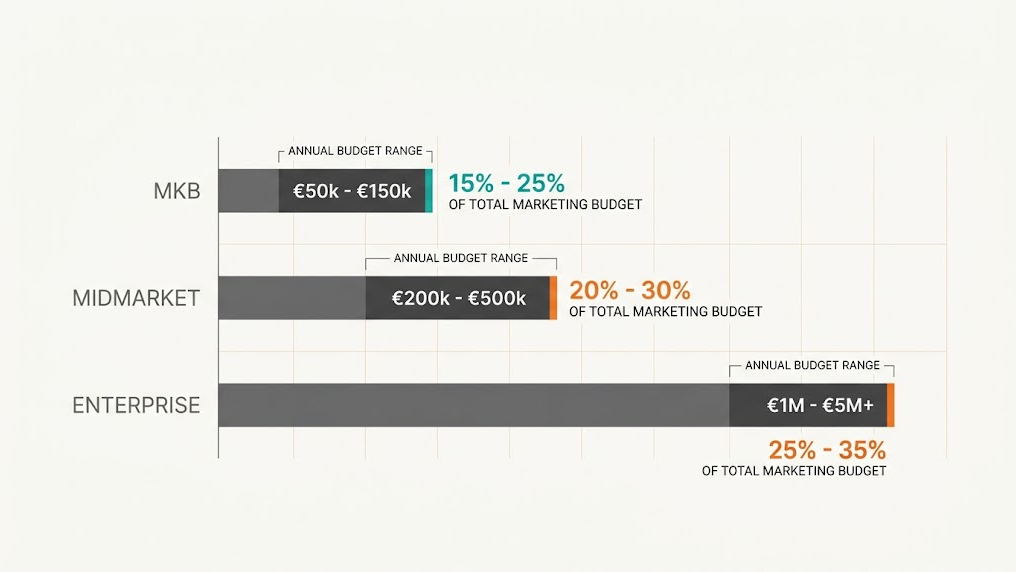
Benchmarks for GEO Investment by Company Size
Concrete figures help with the internal business case. The benchmarks below are based on market analyses and experience we gain from audits across various organizations.
| Company Size | Recommended GEO Budget (Annual) | Percentage of Total Marketing Budget | Primary Focus |
|---|---|---|---|
| SMB (1-50 employees) | € 2,000 to € 8,000 | 5 to 10% | Quick scan and basic optimization |
| Mid-market (50-250 employees) | € 8,000 to € 25,000 | 8 to 15% | In-depth scan, content optimization, trend tracking |
| Enterprise (250+ employees) | € 25,000 to € 75,000+ | 10 to 20% | Competitor scan, continuous monitoring, technical implementation |
These amounts include both the audit and analysis as well as the execution of improvements. The investment in a GEO audit serves as the starting point: you first measure your current position before optimizing.
The Calculation Model: From GEO Score to ROI
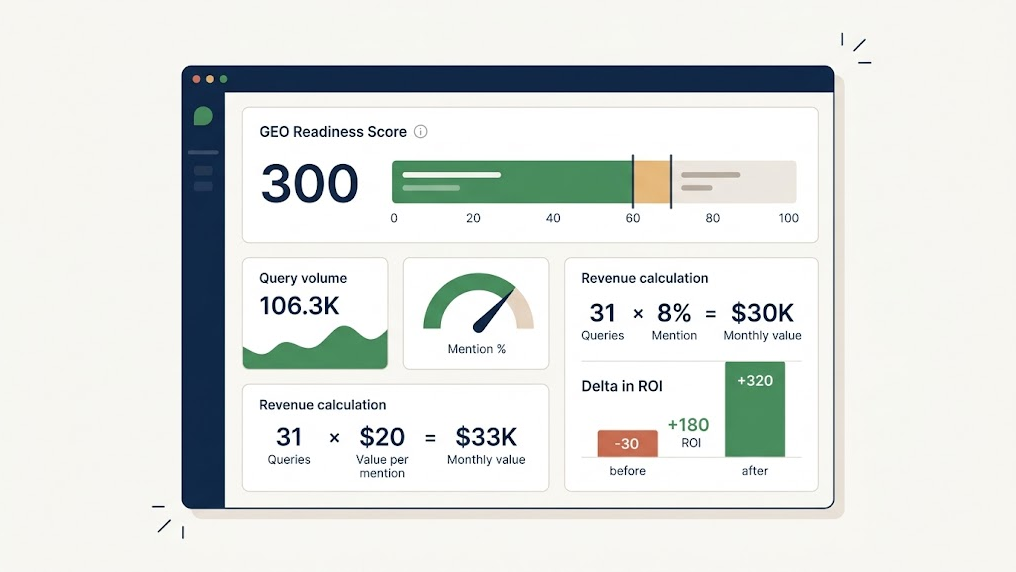
An effective calculation model links your GEO Readiness Score to concrete business impact. It works in four steps.
Step 1: Measure Your Current AI Visibility
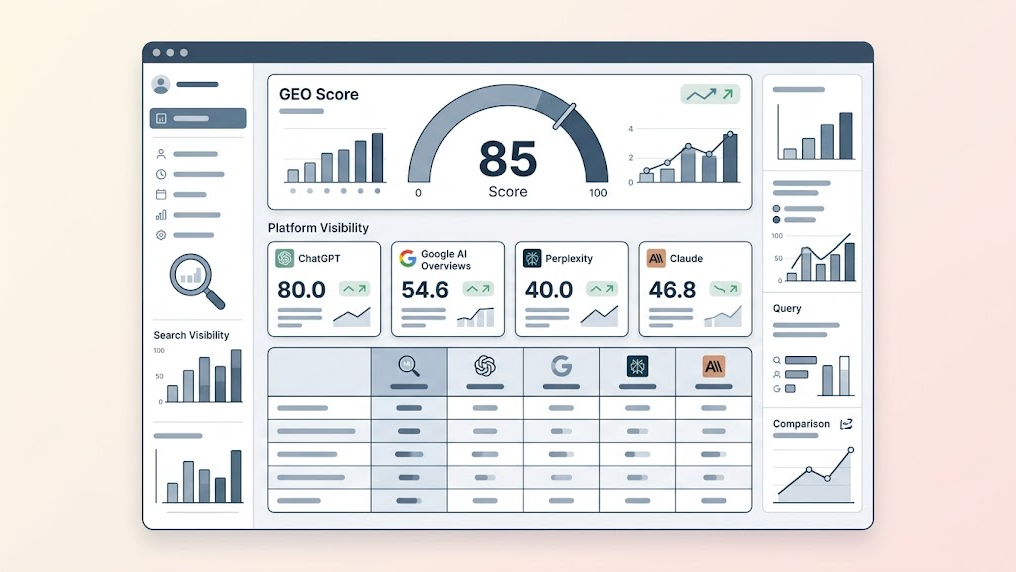
Start with an In-depth Scan (€149 excl. VAT). This analyzes 25 industry-relevant queries across four AI platforms: ChatGPT, Perplexity, Google AI Overviews, and Claude. You receive a GEO Score from 0 to 100 and an executive summary that's immediately usable for stakeholder reporting.
Step 2: Quantify Lost Reach
Calculate how many organic sessions you're losing due to AI answers where your brand is absent. A rule of thumb:
- Identify your top 20 commercial search queries
- Estimate the percentage of queries with AI Overviews (averaging 30 to 50% in B2B)
- Multiply lost traffic by your average conversion value
Step 3: Calculate the Potential Value of AI Mentions
When AI mentions your brand as a trusted source, you gain not just traffic but also authority. Recent studies show that an AI mention generates two to three times more brand trust than a regular search result. Translate this to your average customer value to calculate potential revenue.
Step 4: Set Up Your Investment Framework
Use this formula as a starting point:
GEO Budget = (Lost organic value x 0.3) + audit costs + optimization costs
The factor 0.3 reflects that you won't recover all lost value, but you can recapture a realistic share through AI channels. For most organizations, this delivers a positive business case within six to twelve months.
The Cost of Not Investing: A Competitive Analysis
AI answers are a zero-sum game. If your competitor is mentioned and you aren't, you lose not just a click but also the trust that AI platforms convey to their users.
The competitor scan makes this dynamic visible: you see exactly which players in your industry are being cited.
Imagine three of your five direct competitors are already investing in citability and llms.txt configuration. Each month you wait, their position in training data and live AI engine answers strengthens.
Practical Budget Proposal for the Boardroom
For a marketing manager who must defend budget, a concrete proposal is essential. Below is an example for a mid-market organization.
| Budget Item | Investment (Quarterly) | Explanation |
|---|---|---|
| GEO In-depth Scan | € 149 | Baseline measurement and executive summary |
| Trend Tracking (quarterly report) | € 149 per quarter | Monitor progress and adjust course |
| Content and Technical Optimization | € 1,500 to € 4,000 | Schema markup, citability, llms.txt |
| Internal Hours (coordination) | 8 to 16 hours | Marketing and development alignment |
| Total per Quarter | € 1,800 to € 4,300 |
With current introductory pricing (valid through September 30, 2026), you keep analysis costs low and maximize room for actual optimization.
Next Step: From Benchmark to Action
Budget allocation starts with measurement. Without a current GEO Score, you're building your business case on assumptions instead of data. The In-depth Scan delivers you a complete report within 10 to 15 minutes with expected impact scores and immediately actionable recommendations.
Start your GEO audit today and support your budget proposal with hard numbers. No account needed, no setup, no API keys.
Questions about the right scan option for your organization? Contact us directly and receive personalized advice on your GEO strategy.