The 7 reporting metrics your board wants to see for AI visibility
Every quarterly report comes down to the same question: does our marketing strategy deliver measurable results? Traditional KPIs like organic traffic and click-through rates tell less and less of the story. AI engines like ChatGPT, Perplexity and Google AI Overviews increasingly determine which brand is visible, and which brand doesn't exist.
Your board doesn't want vague stories about "AI trends". They want hard metrics that quantify your brand's position in generative AI.
This checklist gives you the seven reporting metrics to convince stakeholders and secure budget for Generative Engine Optimization (GEO).
1. GEO readiness score: your universal starting point
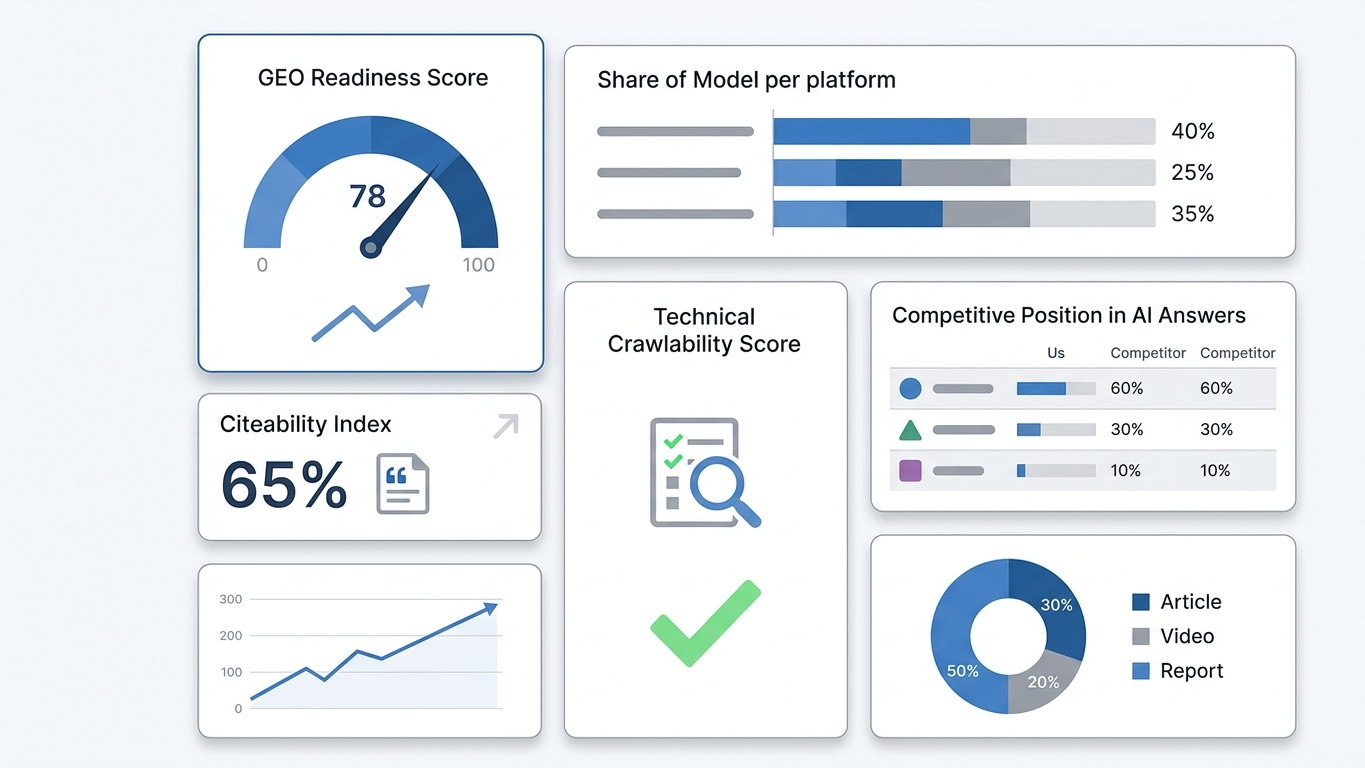
The GEO Readiness Score (0-100) is the only metric that summarizes your website's complete AI readiness in a single number. It is the quintessential boardroom metric, comparable to an NPS for customer satisfaction, but for AI visibility.
Why your board wants to see this: one score makes complex data immediately understandable. Quarter-over-quarter, this score shows the progress of your GEO strategy. Start your audit today and receive your score within 10 minutes.
2. Share of model per platform
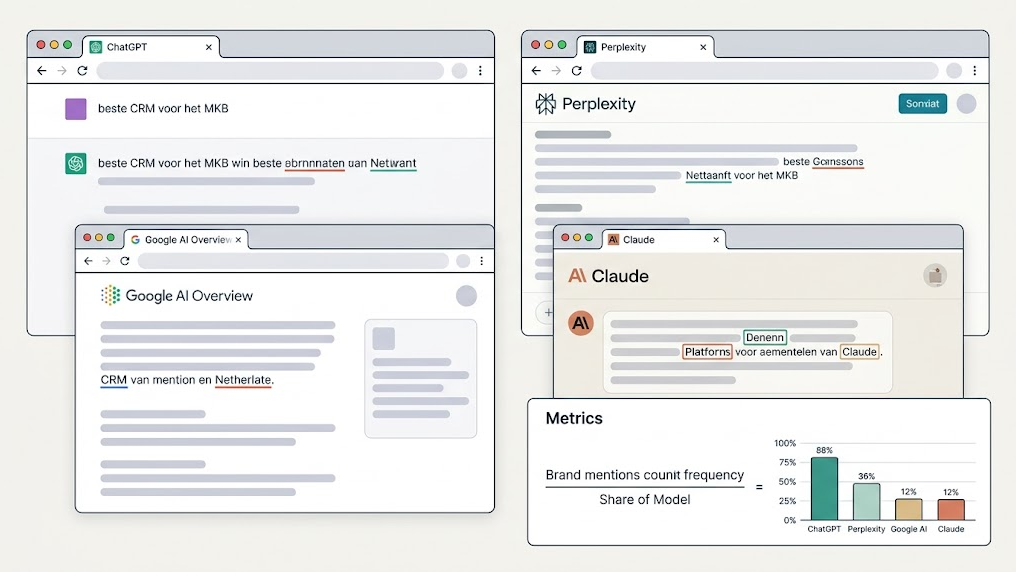
This is the AI equivalent of market share. Report this metric as a percentage per platform:
- ChatGPT: Is your brand recommended for industry-relevant questions?
- Google AI Overviews: Does your content appear in the AI synthesis above organic results?
- Perplexity: Is your website cited as a source?
- Claude: Does the model recognize your expertise?
A Deep Scan with 25 industry-relevant queries provides exactly this data, broken down per platform.
3. Citability index of your content
Your board understands this intuitively: if your competitor gets cited and you don't, you lose authority in the market. This metric forces content teams to write for both human and machine.
4. Technical crawlability score
Without technical access, your website simply doesn't exist for AI. The crawlability score measures whether AI crawlers are allowed to and can index your content. Think of your llms.txt and robots.txt configuration, schema markup and overall technical structure.
This is a binary metric with major impact. Your board needs to answer only one question: are we blocking AI, or are we welcoming AI?
5. Competitive position in AI answers
When a user asks "What is the best solution for X?", the model mentions at most three to five brands. If your competitor is in it and you're not? Then you lose not only visibility, but also the trust of potential customers.
Report this metric as a comparative table:
| Metric | Your brand | Competitor A | Competitor B |
|---|---|---|---|
| Mentioned in ChatGPT | 2/10 queries | 7/10 queries | 4/10 queries |
| Mentioned in Google AI | 1/10 queries | 6/10 queries | 5/10 queries |
| Average position | 3rd place | 1st place | 2nd place |
This data makes the urgency immediately visible. Contact us for a comprehensive competitive analysis.
6. Sentiment classification per AI platform
It's not just about whether you're mentioned, but how. AI engines synthesize information from hundreds of sources. Negative reporting, outdated reviews or incorrect data can lead to negative sentiment in AI answers, without you noticing.
The sentiment classification divides mentions into three categories:
- Positive: Your brand is recommended as a solution
- Neutral: Your brand is mentioned without judgment
- Negative: Your brand is discouraged or negatively contextualized
Your board wants to know if AI judges your organization positively. This metric prevents reputation damage.
7. Quarterly trend and progress reporting
One measurement is a snapshot. Strategic insights only emerge when quarterly tracking begins. The progress report combines all the above metrics into a timeline showing whether your GEO investments are paying off.
Report progress as deltas: "GEO Score increased from 34 to 61 (+79%)". This makes the ROI of GEO concrete and defensible. With the introductory price of the Deep Scan (€149 excl. VAT, valid until September 30, 2026), you build a quarterly rhythm cost-effectively.
Your next step: from checklist to action plan
These seven metrics transform your board presentation from a review of outdated KPIs to a forward-looking view of AI dominance. The difference between organizations that grow and organizations that disappear from AI answers? Those that measure, steer.
See how GrowthScope generates these metrics for you and receive your personal action plan. No account needed, no setup, no API keys. Results within 10 minutes.
Discover why AI engines recommend your competitor instead of you, and turn that around.
Start your audit