The boardroom asks for figures, not hunches. Yet many marketing managers struggle with exactly this problem: how do you translate the complex world of AI visibility into a clear story for stakeholders? While SEO reporting has become standard practice, most organizations lack a structured approach to Generative Engine Optimization (GEO).
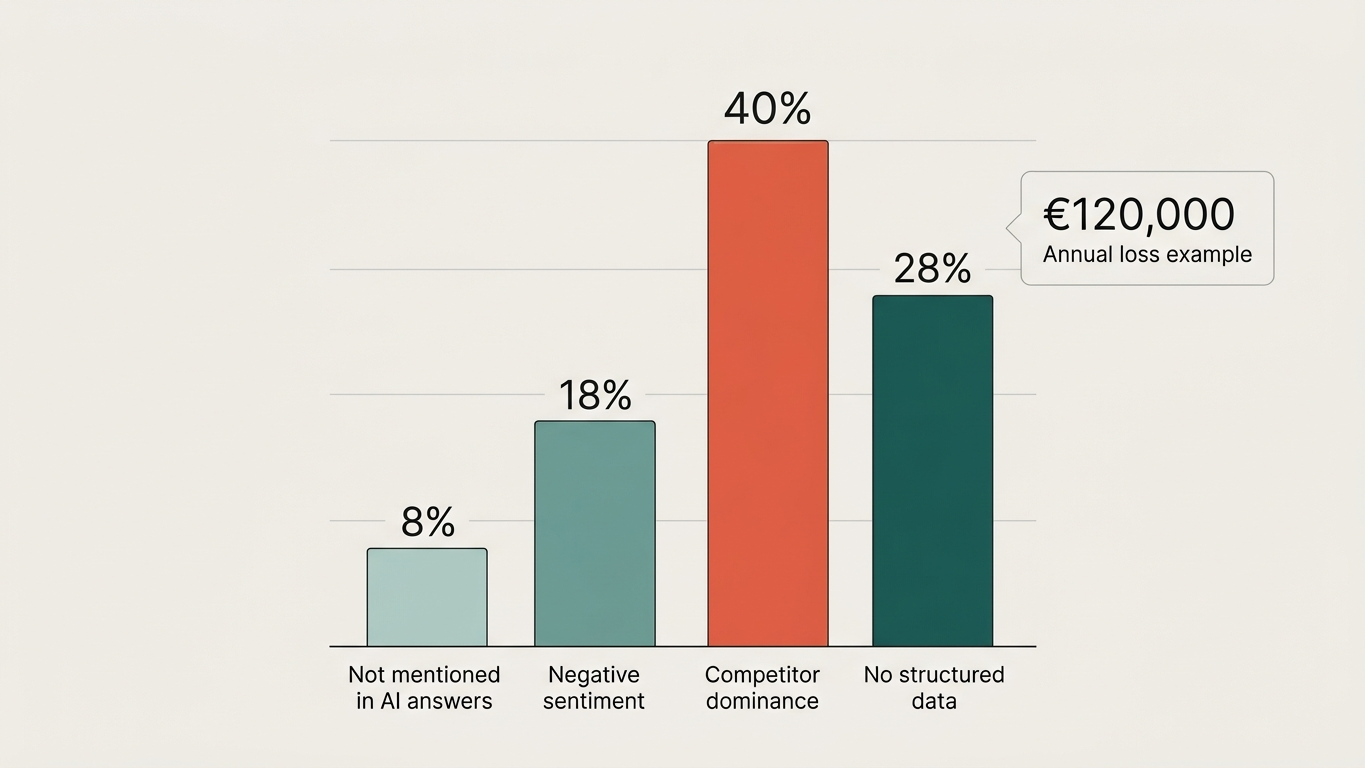
The result? Your board makes decisions about marketing budgets without knowing whether AI engines even mention your brand. Meanwhile, your competitor is capturing that position.
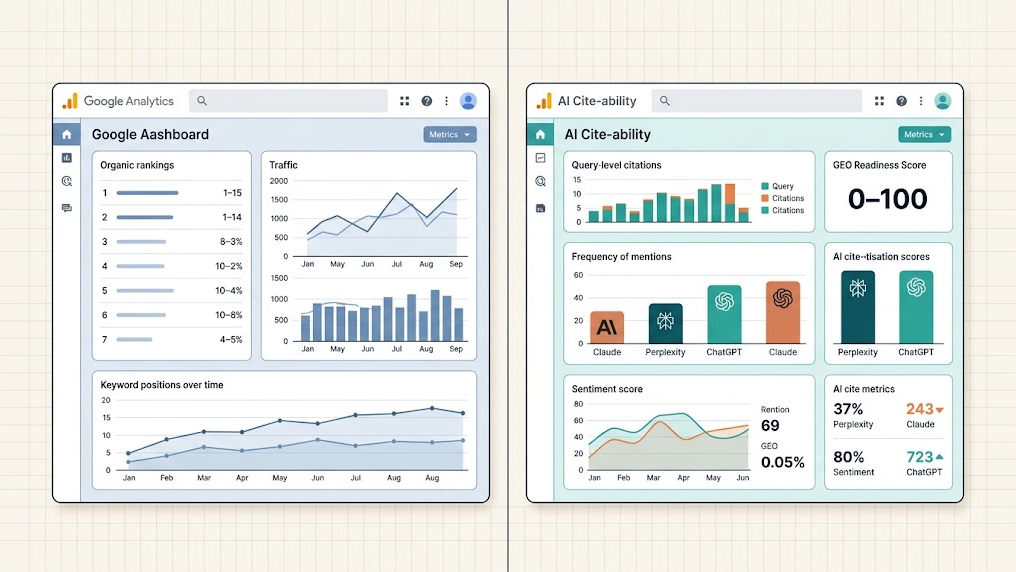
Why traditional reports fall short
Google Analytics and classic SEO dashboards measure clicks, rankings and conversions. But AI engines like ChatGPT, Perplexity and Google AI Overviews work fundamentally differently. Users don't click through to your website. They receive a synthesized answer, with or without your brand as the source.
Your existing KPIs have a blind spot: you can have a perfect position 1 in Google, but be completely absent from the answer ChatGPT generates.
Without a GEO audit you simply don't know where you stand.
The GEO score as central KPI for your board
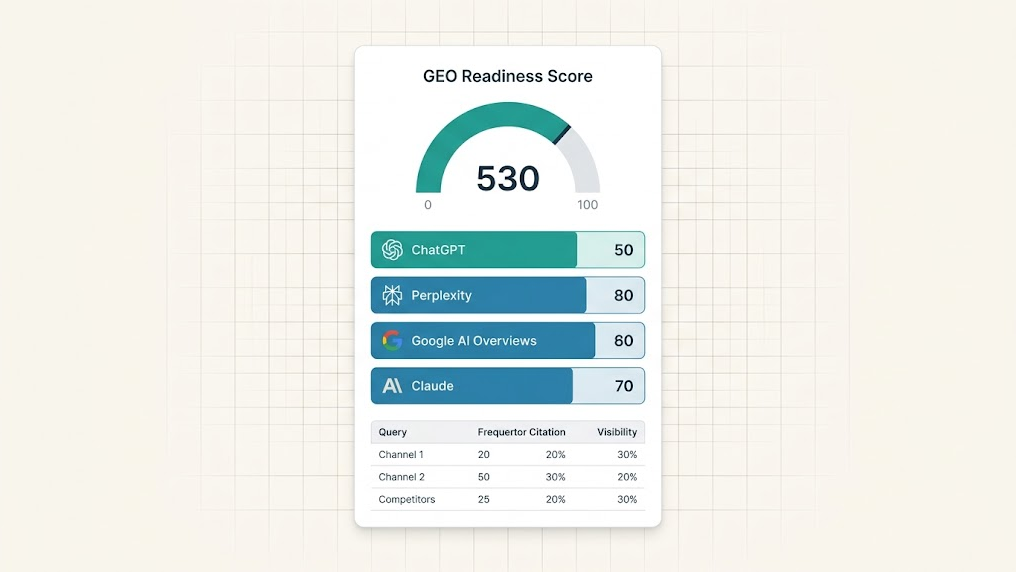
Your board has no need for technical details about schema markup or citability. They want one number that provides direction. The GEO Readiness Score (0 to 100) is exactly that metric.
This score quantifies how well your website performs as a source for AI engines. Think of it as an NPS score for your AI presence. One look at the number tells your board whether action is needed, and how urgent that action is.
What the GEO score measures
| Component | What it means for your board |
|---|---|
| Platform visibility | Is your brand mentioned in ChatGPT, Claude, Perplexity and Google AI Overviews? |
| Citability | Can AI literally adopt your content as a source? |
| Technical readiness | Are your llms.txt and robots.txt correctly configured for AI crawlers? |
| Competitive position | How do you perform versus direct competitors? |
| Sentiment analysis | How positively or negatively is your brand discussed by AI? |
Four steps to board reporting that makes impact
Step 1: start with business context
Don't open your report with data, but with strategic relevance. Use wording like: "43% of our target audience consults AI engines for purchasing decisions. This report shows our position in those answers."
Figures on AI adoption in your industry make the urgency tangible. Your board immediately understands why this topic deserves attention.
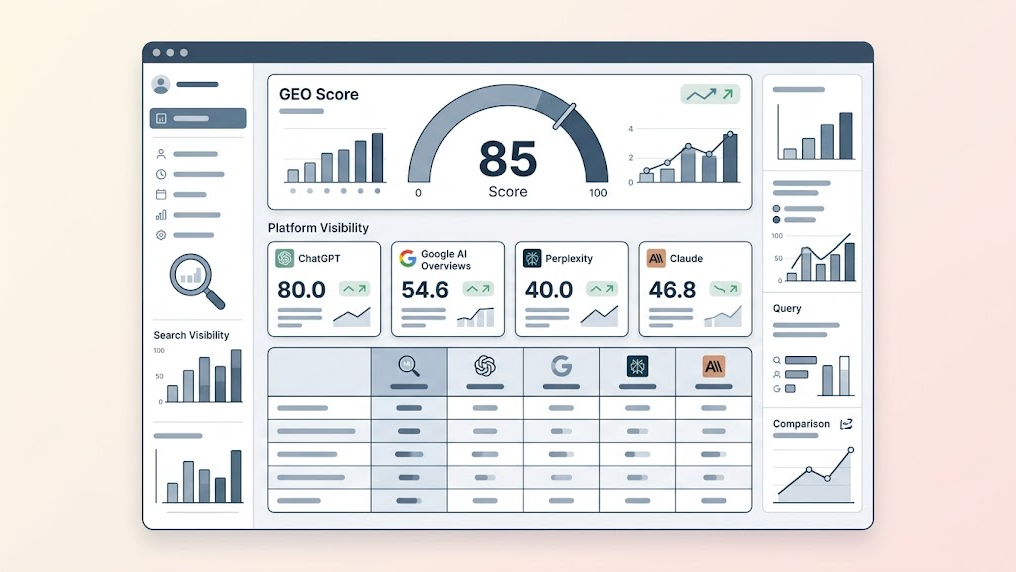
Step 2: present the GEO score as anchor
Display the overarching GEO Score prominently, followed by the breakdown per platform. This gives your board both the big picture and the opportunity to ask questions.
An effective display looks like this:
| Platform | Visibility score | Trend (quarter) |
|---|---|---|
| ChatGPT | 62/100 | +8 |
| Google AI Overviews | 45/100 | +3 |
| Perplexity | 38/100 | -2 |
| Claude | 51/100 | New |
The trend column is crucial. This shows progress over time and justifies ongoing investments in GEO.
Step 3: compare with competition
AI answers are a zero-sum game. If your competitor is recommended, you're not. The Competitive Scan makes this clear by placing your scores alongside up to five competitors.
Nothing creates more urgency than seeing that a competitor consistently scores higher on AI visibility.
Step 4: close with action plan and expected impact
Your board doesn't want problem analysis without direction for solutions. Close every report with three to five concrete action items, including expected impact scores. For example:
- Implement schema markup: expected GEO Score increase +12 points
- Rewrite content for citability: expected increase +8 points
- Configure llms.txt: expected increase +5 points
By linking expected impact to specific actions, you give your board a decision framework for budget allocation.
The reporting frequency that works
A one-time audit is your starting point. But AI visibility is not a static metric. Models are continuously updated, competitors optimize and new platforms emerge.
Quarterly reports via trend tracking provide the consistency your board needs. This way you build a historical data line that makes seasonal patterns, the impact of optimizations and shifts in competitive position visible.
| Report type | Frequency | Suitable for |
|---|---|---|
| Quick scan | One-time | Initial orientation and urgency assessment |
| In-depth scan | Quarterly | Strategic decision-making and budget justification |
| Competitive scan | Semi-annually | Market positioning and benchmarking |
Common mistakes in AI visibility reporting
Avoid these pitfalls to protect your credibility as a marketing manager:
- Reporting too technically. Your board doesn't need to know what structured data is. They need to know what it delivers.
- Not using a benchmark. A GEO Score of 54 says little without context. Always compare with competitors or your own previous measurement.
- Reporting once and stopping. AI visibility shifts continuously. Without quarterly updates, you lose momentum and your board's attention.
Start your first report today
The introductory price for the In-depth Scan (valid through September 30, 2026) makes this the ideal time to assemble your first AI visibility report. Within 10 to 15 minutes you receive a complete report with executive summary, platform scores and an action plan.
No account needed. No setup. No API keys. Start your audit and give your board the data they need to take GEO seriously.
Have questions about setting up a structured reporting cycle? Get in touch and we'll think it through with you.