Your marketing team reports monthly on organic traffic, conversion rates and ad spend. But who reports on whether AI engines mention your brand at all? Without a structured Quarterly Business Review (QBR) for GEO performance, you're missing the insight your competitors are already gathering.
This template gives you a ready-made framework to measure, present and translate your GEO performance into strategic decisions each quarter.
Why a QBR template for GEO is essential
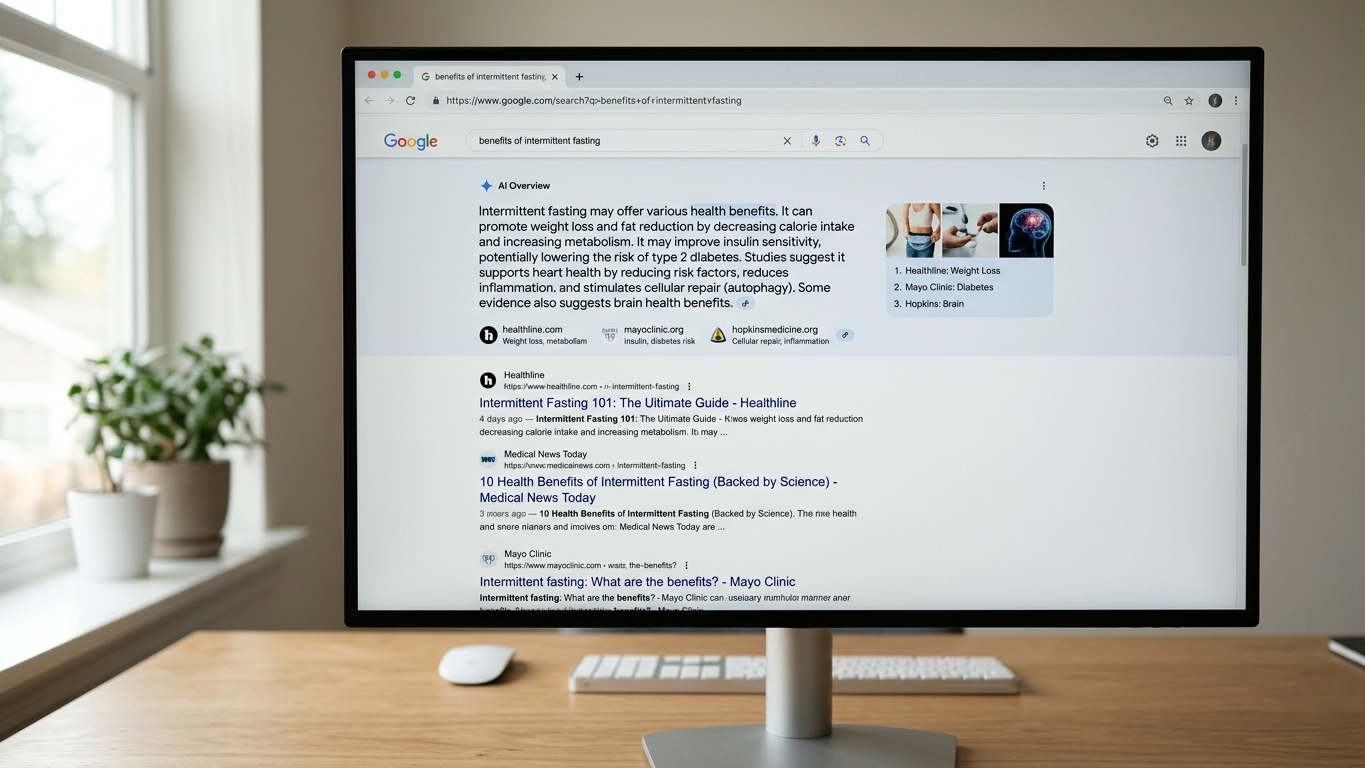
The shift from traditional search results to AI-generated answers is changing the rules of the game. ChatGPT, Perplexity, Google AI Overviews and Claude synthesize information and present only a few sources to the user. This is a zero-sum game: if your competitor is mentioned, you're invisible.
A quarterly report for generative engine optimization gives you three crucial advantages:
- Quantifiable progress that you can present to stakeholders and management.
- Trend recognition that lets you adjust course before competitors take over your position.
- Budget justification to justify marketing investments in GEO with hard data.
Without structure, AI visibility remains a vague concept. With this template, it becomes a boardroom metric.
The structure of your GEO quarterly business review
An effective QBR follows a fixed structure. Below you'll find the complete framework that you can adopt directly for your next quarterly report.
1. Executive summary
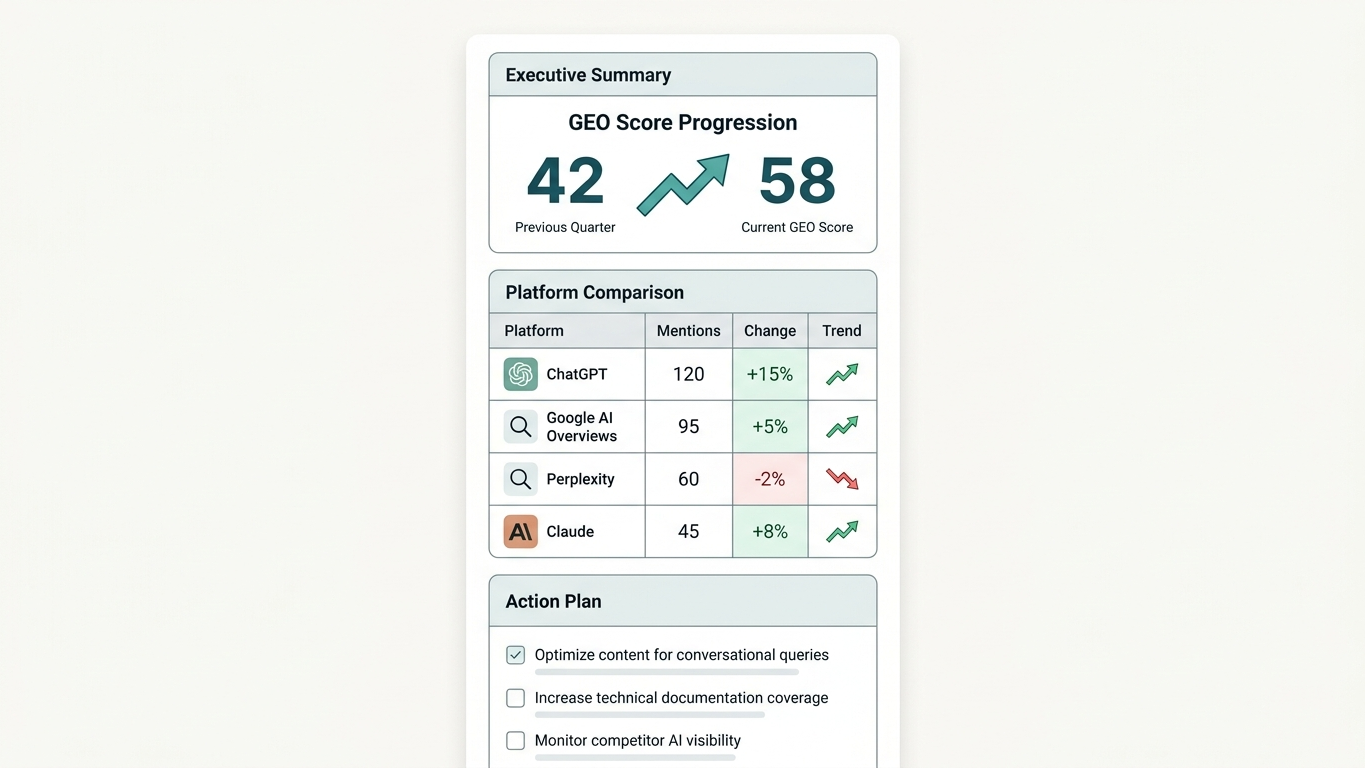
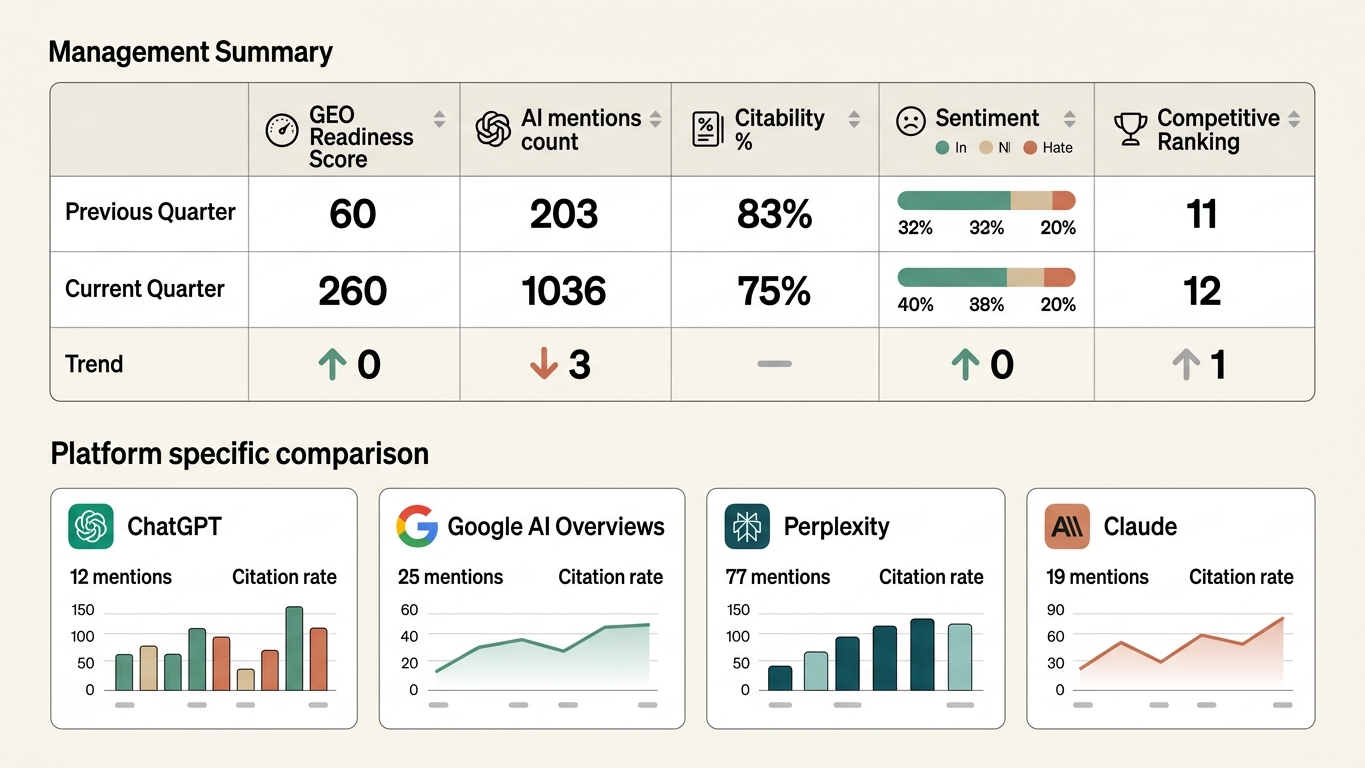
Start with the essentials. Your management wants to understand the status within 60 seconds. Use the table below as a starting point:
| Metric | Previous quarter | Current quarter | Trend |
|---|---|---|---|
| GEO Readiness Score (0-100) | [score] | [score] | ↑ / ↓ / → |
| Number of AI mentions | [number] | [number] | ↑ / ↓ / → |
| Citability (%) | [percentage] | [percentage] | ↑ / ↓ / → |
| Sentiment (positive/neutral/negative) | [distribution] | [distribution] | ↑ / ↓ / → |
| Competitive position (ranking) | [position] | [position] | ↑ / ↓ / → |
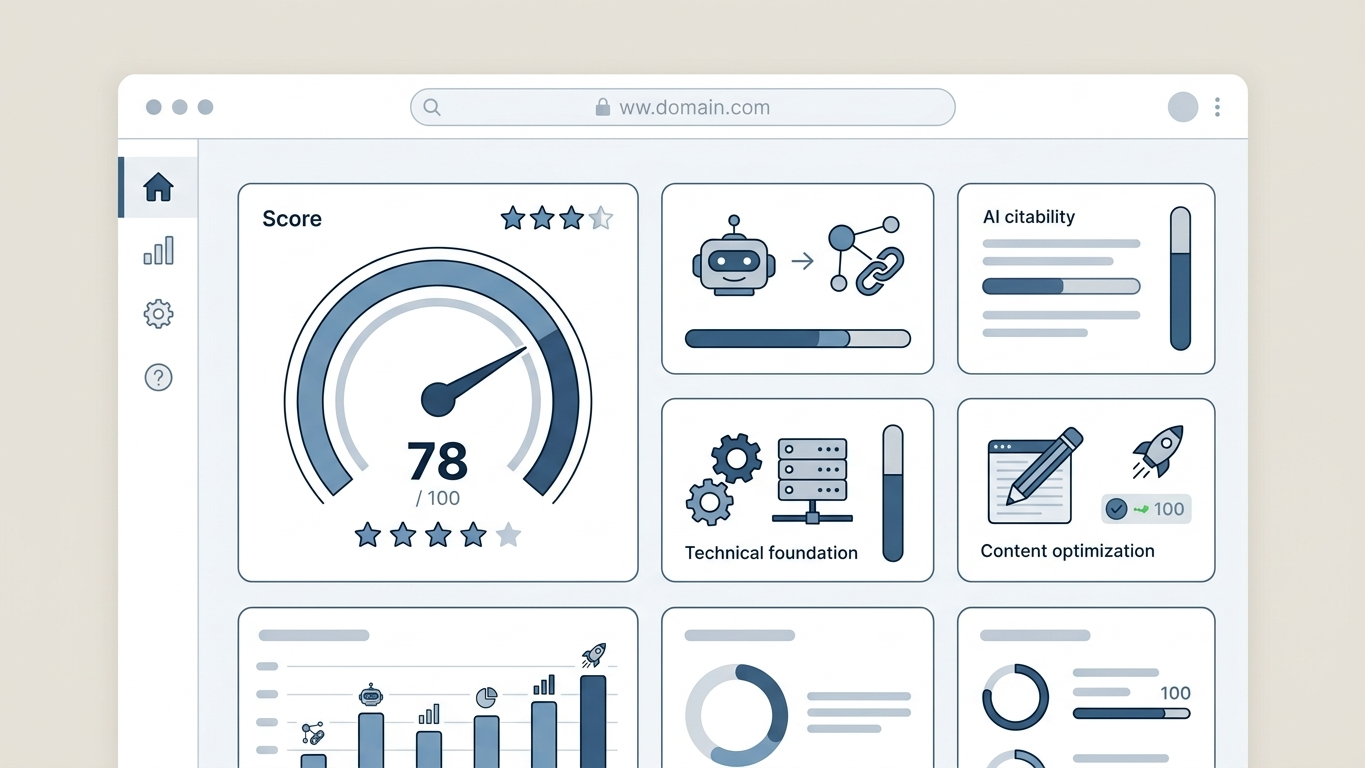
The GEO Readiness Score is your central KPI. This score bundles technical readiness, citability and actual AI mentions into a single number that is directly comparable between quarters.
2. Platform-specific analysis
Not every AI platform treats your brand equally. Break down your results by platform to make targeted adjustments:
- ChatGPT: How often is your brand mentioned in responses to industry-relevant questions?
- Google AI Overviews: Does your content appear in AI summaries above organic results?
- Perplexity: Is your website cited as a source with a direct link?
- Claude: How does Anthropic's model position your expertise against competitors?
The Deep Scan tests your domain with 25 industry-relevant queries across these four platforms. This provides the statistical significance you need for substantiated reporting.
3. Competitive comparison
Your own score only means something in context. Include a competitive analysis in every QBR with at least three direct competitors.
| Domain | GEO Score | ChatGPT mentions | Perplexity mentions | Strongest point |
|---|---|---|---|---|
| Your domain | [score] | [number] | [number] | [e.g. citability] |
| Competitor A | [score] | [number] | [number] | [e.g. schema markup] |
| Competitor B | [score] | [number] | [number] | [e.g. content depth] |
| Competitor C | [score] | [number] | [number] | [e.g. llms.txt] |
This comparison immediately reveals where your opportunities lie. Is a competitor scoring high on citability? Then you know where your content team should focus.
4. Technical GEO status
Report each quarter on the technical fundamentals that determine whether AI crawlers can find and process your content:
- Schema markup: Are all relevant pages provided with structured data?
- llms.txt: Is your llms.txt file up to date and correctly configured?
- robots.txt: Are your current settings unintentionally blocking AI crawlers?
- Content structure: Are your texts organized into citable, defined paragraphs?
This checklist prevents technical barriers from undermining your content efforts.
5. Action plan for next quarter
Close each QBR with a maximum of five concrete action items. Prioritize based on expected impact:
| Action | Responsible | Deadline | Expected impact on GEO Score |
|---|---|---|---|
| [e.g. Expand schema markup] | [name/team] | [date] | +[points] |
| [e.g. Implement llms.txt] | [name/team] | [date] | +[points] |
| [e.g. Rewrite 10 FAQ pages] | [name/team] | [date] | +[points] |
How to start using this template immediately
You don't need to wait until the end of the quarter to start. Begin your baseline measurement today:
- Run your first scan: Enter your domain on GrowthScope and receive your GEO Readiness Score within 10 minutes. No account needed, no setup.
- Fill in the template: Use the scores from your report as the baseline for the first row in each table.
- Schedule your next measurement: Set a reminder for three months from now. The quarterly trend tracking shows whether your optimizations are working.
The introductory price for the Deep Scan is €149 excl. VAT (valid until September 30, 2026). For organizations that want to make structural adjustments, the quarterly report provides the continuity that GEO as a process requires.
From template to strategic advantage
By measuring the same metrics each quarter, you build a historical view that reveals trends before your competitors notice them.
A QBR template is not a bureaucratic document. It's your translation of AI complexity into boardroom language.
The market for AI visibility is in its early stages. Organizations that start measuring systematically now are building a competitive advantage that will be difficult to catch up with later. Contact us if you want support setting up your first GEO reporting cycle.
Start your baseline measurement today and give your next QBR the AI dimension it deserves.